BISM MD: Introduction to Evaluation Nodes
Posted by thomasivarssonmalmo on June 21, 2013
This is the first introduction to the concept of evaluation nodes in SQL Server Profiler and what they can tell you about what is going on in the SSAS engine. I would also like to examine where the evaluation nodes show up in the Profiler trace. Evaluation nodes were introduced as events in SQL Server Profiler with the SQL Server 2012 release. They have been part of the engine before that but it is in the SQL Server 2012 edition they were added as Profiler Events.
I must acknowledge Akshai Mirchandani, from Microsoft, who has answered my questions and given me feedback on this text. If anything is wrong here, blame me.
SSAS/BISM Multidimensional Query Plans
SSAS produces query plans like the SQL Server RDBMS when receiving queries and before doing any real physical work and retrieve data. Query plans in multidimensional structures are complex and would require many chapters in a book to cover. It is not possible to go into all details about how this works in SSAS/BISM MD in this blog post. I refer to the Analysis Services 2008 unleashed for details.
There are two main parts that works in this process and that is the Formula Engine (FE), which does most of the work, except for going to the disk system and retrieve data. A simplified general picture is that the FE handles the MDX (queries) sent to SSAS and breaks that request down into small parts, called sub cubes. It then tries to find out if it can find the data in the FE cache or will have to send it further to the Storage Engine.
Retrieving actual data from disk or the file system cache is the work handled by the other part, the Storage Engine (SE) unless there is data cached in the FE.
Logical and Physical Query Plans
The SSAS FE creates both logical and physical query plans. The SE has its own query plans and it is not a part of this blog post. The word plan here is not fully accurate since the profiler trace shows how the query was executed and not a planned query execution. SQL Server RDBMS query optimizer use estimated query plans and actual query plans but that is not the fact for SSAS/BISM MD.
Evaluation nodes are essentially nodes in the logical plan. Instead of using the word logical query plan it is recommended to use Evaluation node. They get converted into nodes in the physical plan and might get executed. Evaluation nodes can be created but not always executed. They can also be cached and used by other cells during query execution. All of this takes place in the Formula Engine.
Physical plan nodes in the FE implement calculation operations like multiplication and division but nothing of that are exposed in the profiler trace events for evaluation nodes.
Can Evaluation Nodes help in Query Execution Analysis?
Evaluation nodes are chatty events like most SQL Server Profiler Trace events for SSAS/ BISM MD. A lot of data gets generated and not in a friendly User Interface. With more complex calculations than this example you can get a lot of Evaluation Node events that can be hard to find patterns in. This blog post can help you with seeing how the Evaluation Nodes appears as three groups of events, one group that will get executed and two that will not get executed. The post will also help you to find the xml-tags with interesting information about the query plan.
An example of interesting information is if evaluation node is run in cell by cell mode or block mode. Have a look at the table at the end of this blog post where several xml-tags in an evaluation node are explained.
The cube used and the queries
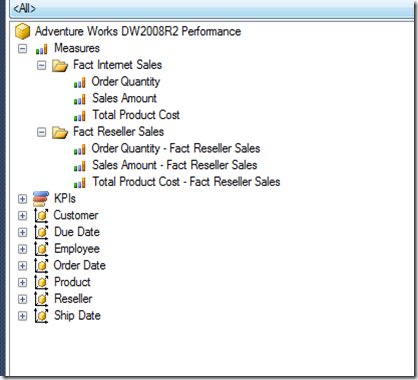
This is my sample cube with two measure groups (no calculations or measure expressions). It is the same cube that I used in my previous blog post.
There are no natural or user hierarchies’ only attribute hierarchies. Each MG has only one partition. There are no MDX scripts and no aggregations. The aggregation property of each attribute are set to default.
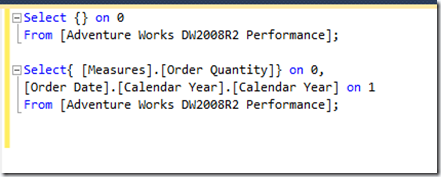
This is the first query that was executed on a non-cached cube.
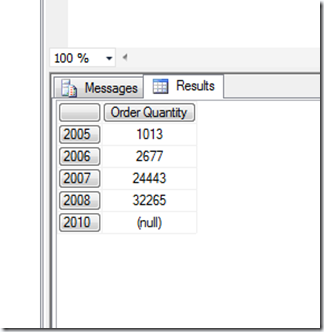
Below is the result of the simple query above.
The Complete Profiler Trace
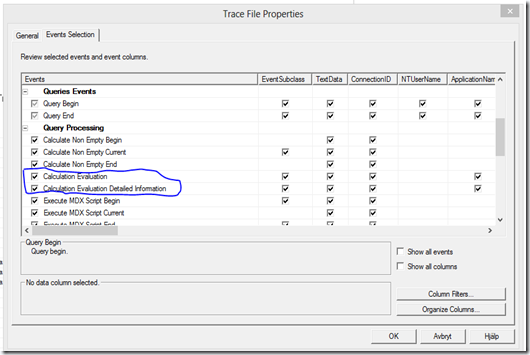
To set up the trace with Profiler you need to add these events before running the query above.
I assume that the reader know how to configure the SQL Server Profiler.
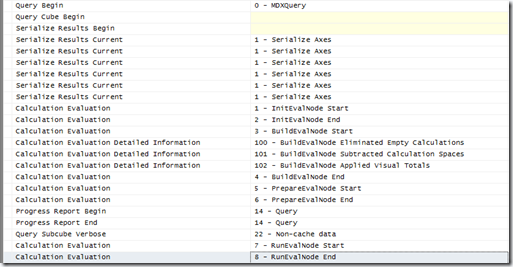
Here is the first part of the Profiler Trace events.
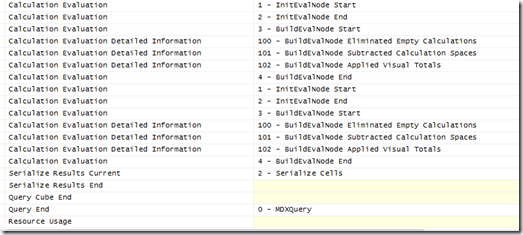
This is the second part of the profiler with the event following the last event above.
Grouping the Trace Events
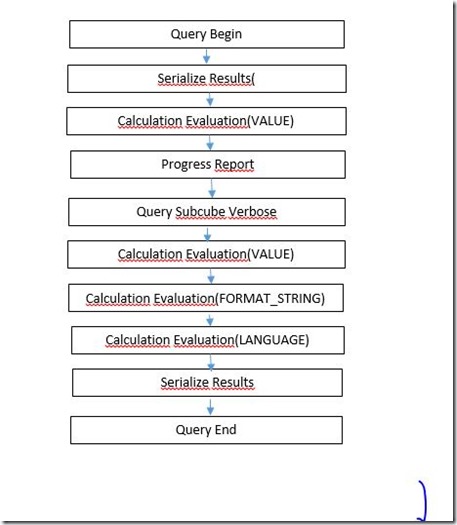
Let me first try to describe what is going on here with a high level picture.
The VALUE, FORMAT_STRING and LANGUAGE groups are derived from an xml-tag (CellProperty) in each evaluation node events that will be shown later. Each group of evaluation nodes have their own NodeIndex-property. The first group starts with NodeIndex 0.
First the FE starts with analyzing the sets on each axis and builds subcubes that covers these sets. Then an iteration over the cells starts with a request of the current cells property value. Each intersection of axis sets points to a cell. FE will then find a subcube that was previously built and then create an evaluation node for that subcube. This will trigger the Init-Build-Prepare of the evaluation node in the Profiler trace. Data is then requested from the SE that is needed by this evaluation node, including data needed by other evaluation nodes (look at the Query Subcube Verbose event in the Profiler Trace), that were created indirectly by the Build/Prepare phases. Now it is time to run the evaluation node (event 7, RunEvalNode Start and 8, RunEvalNode End). This is optional sometimes since because evaluation nodes do not always have to be run (for non-value cell properties or cell-by-cell mode). Finally the value for the current cell property is fetched as a result of running the evaluation node (or calculate it as a cell-by-cell operation). Then these steps are repeated for the next cell.
I we look at the Profiler trace earlier we can see that the evaluation node that was run was cached and used by the other cells. The two later groups with CellProperties(, FORMAT_STRING, LANGUAGE) were never run since they do not have the RunEvalNode-events after them as their last step.
This is the first group of Evaluation nodes will CellProperty (VALUE) and NodeIndex(0).
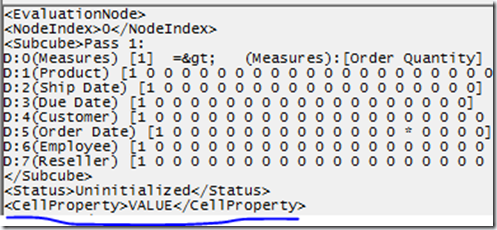
If I click on the Calculation Evaluation-2 InitEvalNodeEnd of the first group I can see this property:
Single Evaluation Nodes: Prefetch Operation
To add up the discussion about the first group of evaluation nodes we can say this:
- · The evaluation nodes are initialized and built
- · The same group of evaluation nodes are then prepared.
- · The evaluation nodes are run.
Actually there is also a less clear step included in this group. That is a prefetch operation were all SE requests for all evaluation nodes that have been prepared are issued to the SE. The prefetch gathers together the subcubes that were detected as part of the prepare phase of o or more evaluation nodes and not just the last one. There is no event in the trace indicating the prefetch itself. This prefetch operation is a SE request for all prepared evaluation nodes and that is why the evaluation nodes show intermingling of SE queries. After the prefetching is finished the evaluation node can be run.
This is the second group with CellProperty (FORMAT_STRING) that was not run.
There is no RunEvalNode event in this group.
This is the third group with CellProperty (Language) that also was not run
Like the previous group of evaluation node events there is no RunEvalNode event in this group.
Evaluation node tags for the run evaluation node
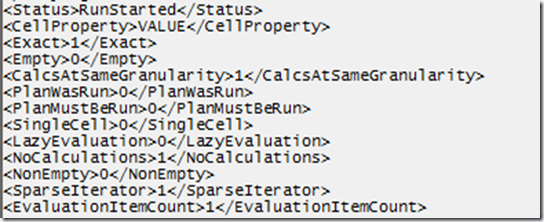
Here I have two fragments from the same evaluation node in Profiler.
I refer to the table for details about each tag. The most interesting here are:
- · <Exact>1</Exact>: Which means that the subcube is an exact match.
- · <LazyEvalutation>0</LazyEvaluation>: The evaluation node was run in bulked mode
- · <SparseIterator>1</SparseIterator>: The evaluation node did not have to iterate over the entire cube. It was iterated over a smaller, sparse , space.
The collection of the tags i refer to are here.
Summary
This blog post is an introduction to evaluation nodes in SQL Server Profiler with the scenario of a cube with no calculations. This is why the resulting information from the profiler trace in this scenario is limited. The next post will have a look at evaluation nodes when MDX expressions are involved.
Table:Evaluation Node Tags
|
EvaluationNodeTag |
Explanation |
|
Exact |
Exact means that the subcube is an exact match of the cells that are needed by the query. Sometimes the server can build a subcube that is *larger* than the cells needed by the query, and in that case Exact will be false. |
|
Empty |
Empty means that the result of this evaluation node is empty, none of the cells have any data . This can happen if you have a subcube that is somehow not valid (e.g. perhaps the subcube has a coordinate that doesn’t auto-exist with other coordinates or perhaps some other situation where calculations get eliminated until nothing remains and the subspace is guaranteed to have no cells with data). |
|
PlanWasRun |
PlanWasRun means the execution plan for this evaluation node has or has not yet been run. It will get run when the Run events show up – or it will *never* be run, because FE ends up fetching cell values in a cell-by-cell mode. |
|
PlanMustBeRun |
PlanMustBeRun is too internal to explain. But essentially there are some situations where we build an evaluation node, and it turns out that it matches another evaluation node that has already been executed – in that case, we can just point the evaluation node to the cached result of that earlier evaluation node, and the plan for the new evaluation node does not need to be run, and so the flag will be set to false. |
|
NaiveEvaluation |
This is on the evaluation node item. Use the value of the LazyEvaluation tag instead. |
|
Status |
PrePareStarted/Built/Uninitialized/RunStarted/RunSucceeded |
|
CalcsAtSameGranularity |
This indicates whether the calculations are on the same granularity or not. |
|
SingleCell |
This means whether the subcube of the evaluation node is for single cell coordinates. This may translate into cell-by-cell. |
|
LazyEvaluation |
Indicates cell-by-cell mode or bulk evaluation. |
|
SparseIterator |
When in block mode, do we have to iterate over the entire (dense) space of the entire subcube or can we iterate over a smaller (sparse) space. Remember that Sparse iteration is good. E.g. if you have a calculation with the expression [Measure1] * 2, and Measure1 is a storage engine measure, then we can execute a storage engine request and iterate just over the cells returned by the Storage engine request – which is a much sparser space than the entire subspace because many of the cell values are null and we don’t need to calculate them at all. |
|
EvaluationItemCount |
The number of calculations that apply to the subspace – these can change as we proceed through the stages of Init/Build/Prepare, because some of the calculations will get overlapped/split/eliminated. The final set is what you see at the end of Prepare or the beginning of Run |
|
Overlaps |
Overlaps means whether individual calculations overlap with each other. E.g. a scope on all states and a scope on the state of Washington – the item representing the first calculation has an overlapping calculation. |
|
CoversFullSpace |
CoversFullSpace means whether the calculation item covers the full space of the evaluation node, or whether the item has filters (e.g. State = Washington) that make it smaller than the full space of the evaluation node. |
|
HasConditions |
HasConditions refers to IF conditions in the calculations. |
|
NoCalculations |
0 -> Only Storage Engine Query |
|
CellProperty |
As discussed above. |
|
CalculationLocation |
This is the location of the calculation. When it is only SE queries this tag contains the measure group. In general it will contain the location and expression that applies to the evaluation node item. |
|
VaryingAttributes |
Drives the way the expression is evaluated and makes the expression dependant upon it. The 0s and 1s are bits and the numbers from 0 to 140 are the bits that are turned on . |





Leave a comment